Did the G Train Shutdown Turn Commuters into Cyclists?
In summer 2024 the G train shutdown led many riders to travel via Citi Bike. Those riders kept on biking.

In 2024 the G train experienced major shutdowns between June and September. This meant the 160,000+ riders who take it daily needed a new way to get around.
The MTA ran a shuttle bus along the G train route as a replacement. Citi Bike was another popular alternative.
Let’s find out how the shutdown impacted Citi Bike!
To explore how the shutdown affected Citi Bike usage, we’ll use a web app that tracks trips aggregated into hexagonal cells. Users can select origin or destination regions to view trip statistics.
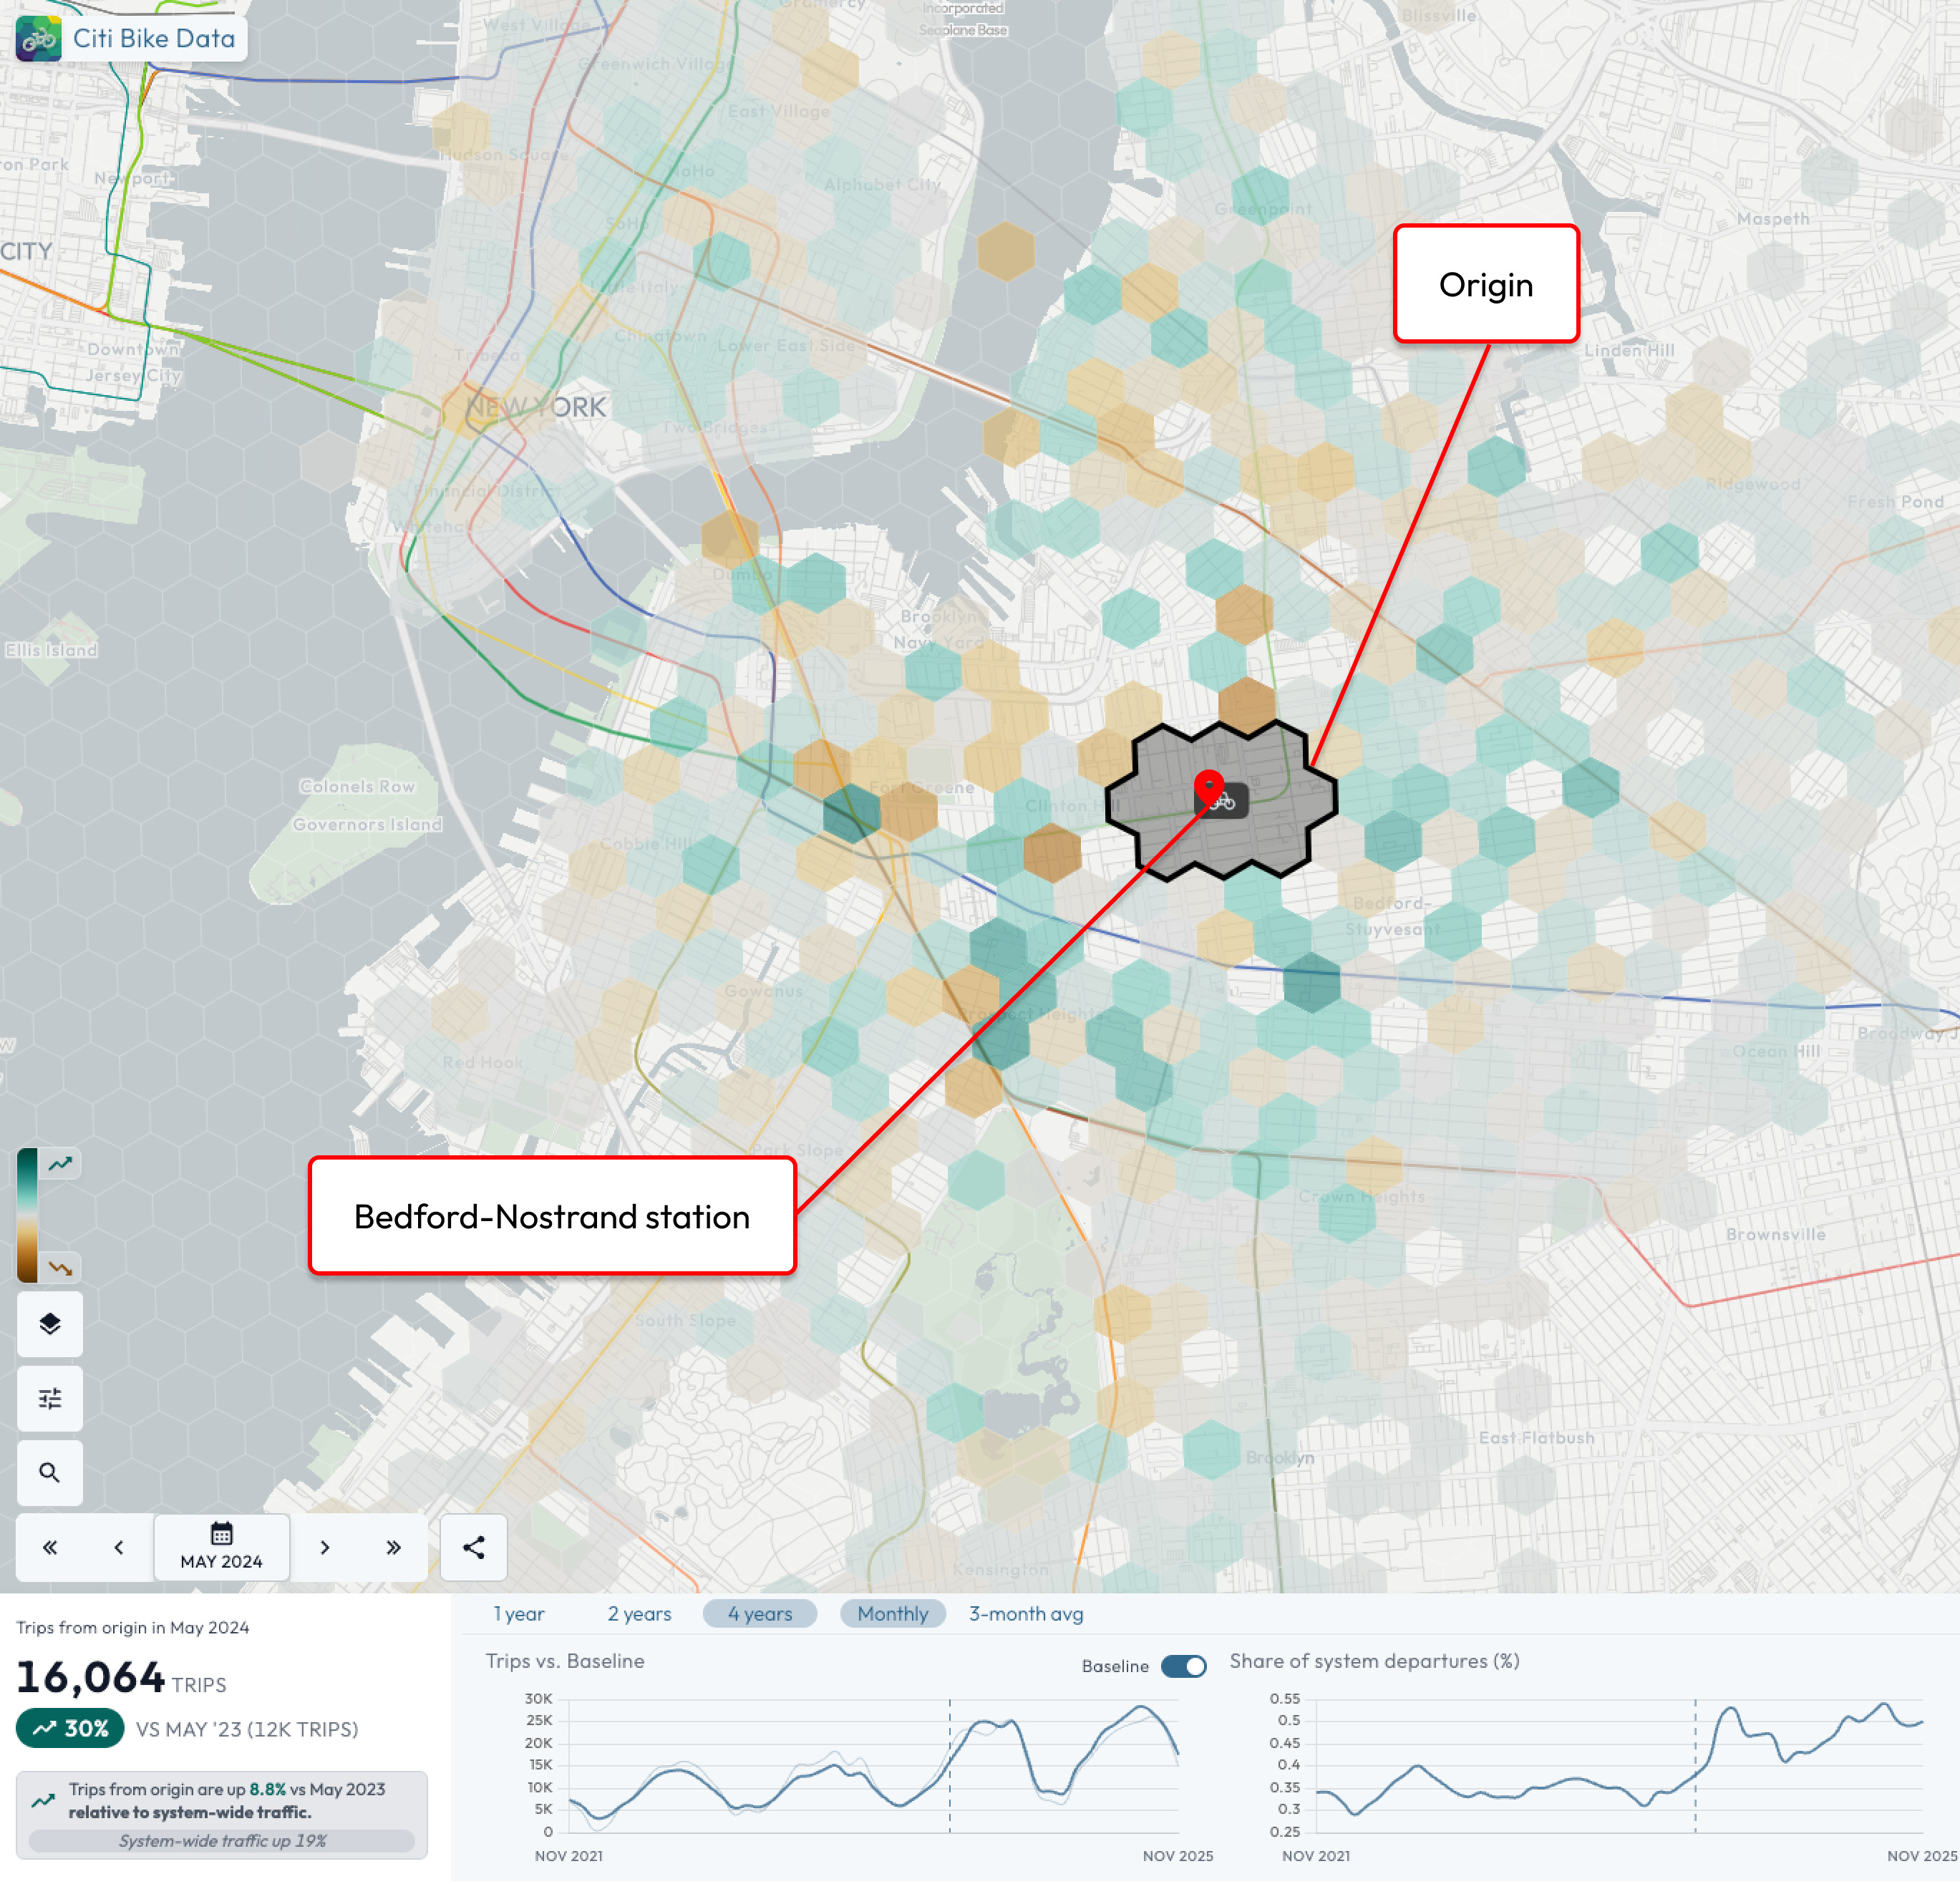
Using the app’s comparison mode, I’ve selected a region around the Bedford-Nostrand G train station as the origin (see screenshot below). The map shows year-over-year changes in trips from this origin to each cell, normalized against overall system traffic:
Turquoise = increase above system average
Brown = decrease relative to system average
Gray = no significant change
For example, overall traffic grew 19% from May 2023 to May 2024, so a cell only appears turquoise if its trips increased by more than 19%. We’ll refer to the system traffic figure as the expected growth going forward.
There are some shifts happening in May 2024 vs. May 2023 but no clear patterns. Let’s skip ahead to July 2024 — the core of the phase 1 shutdown.
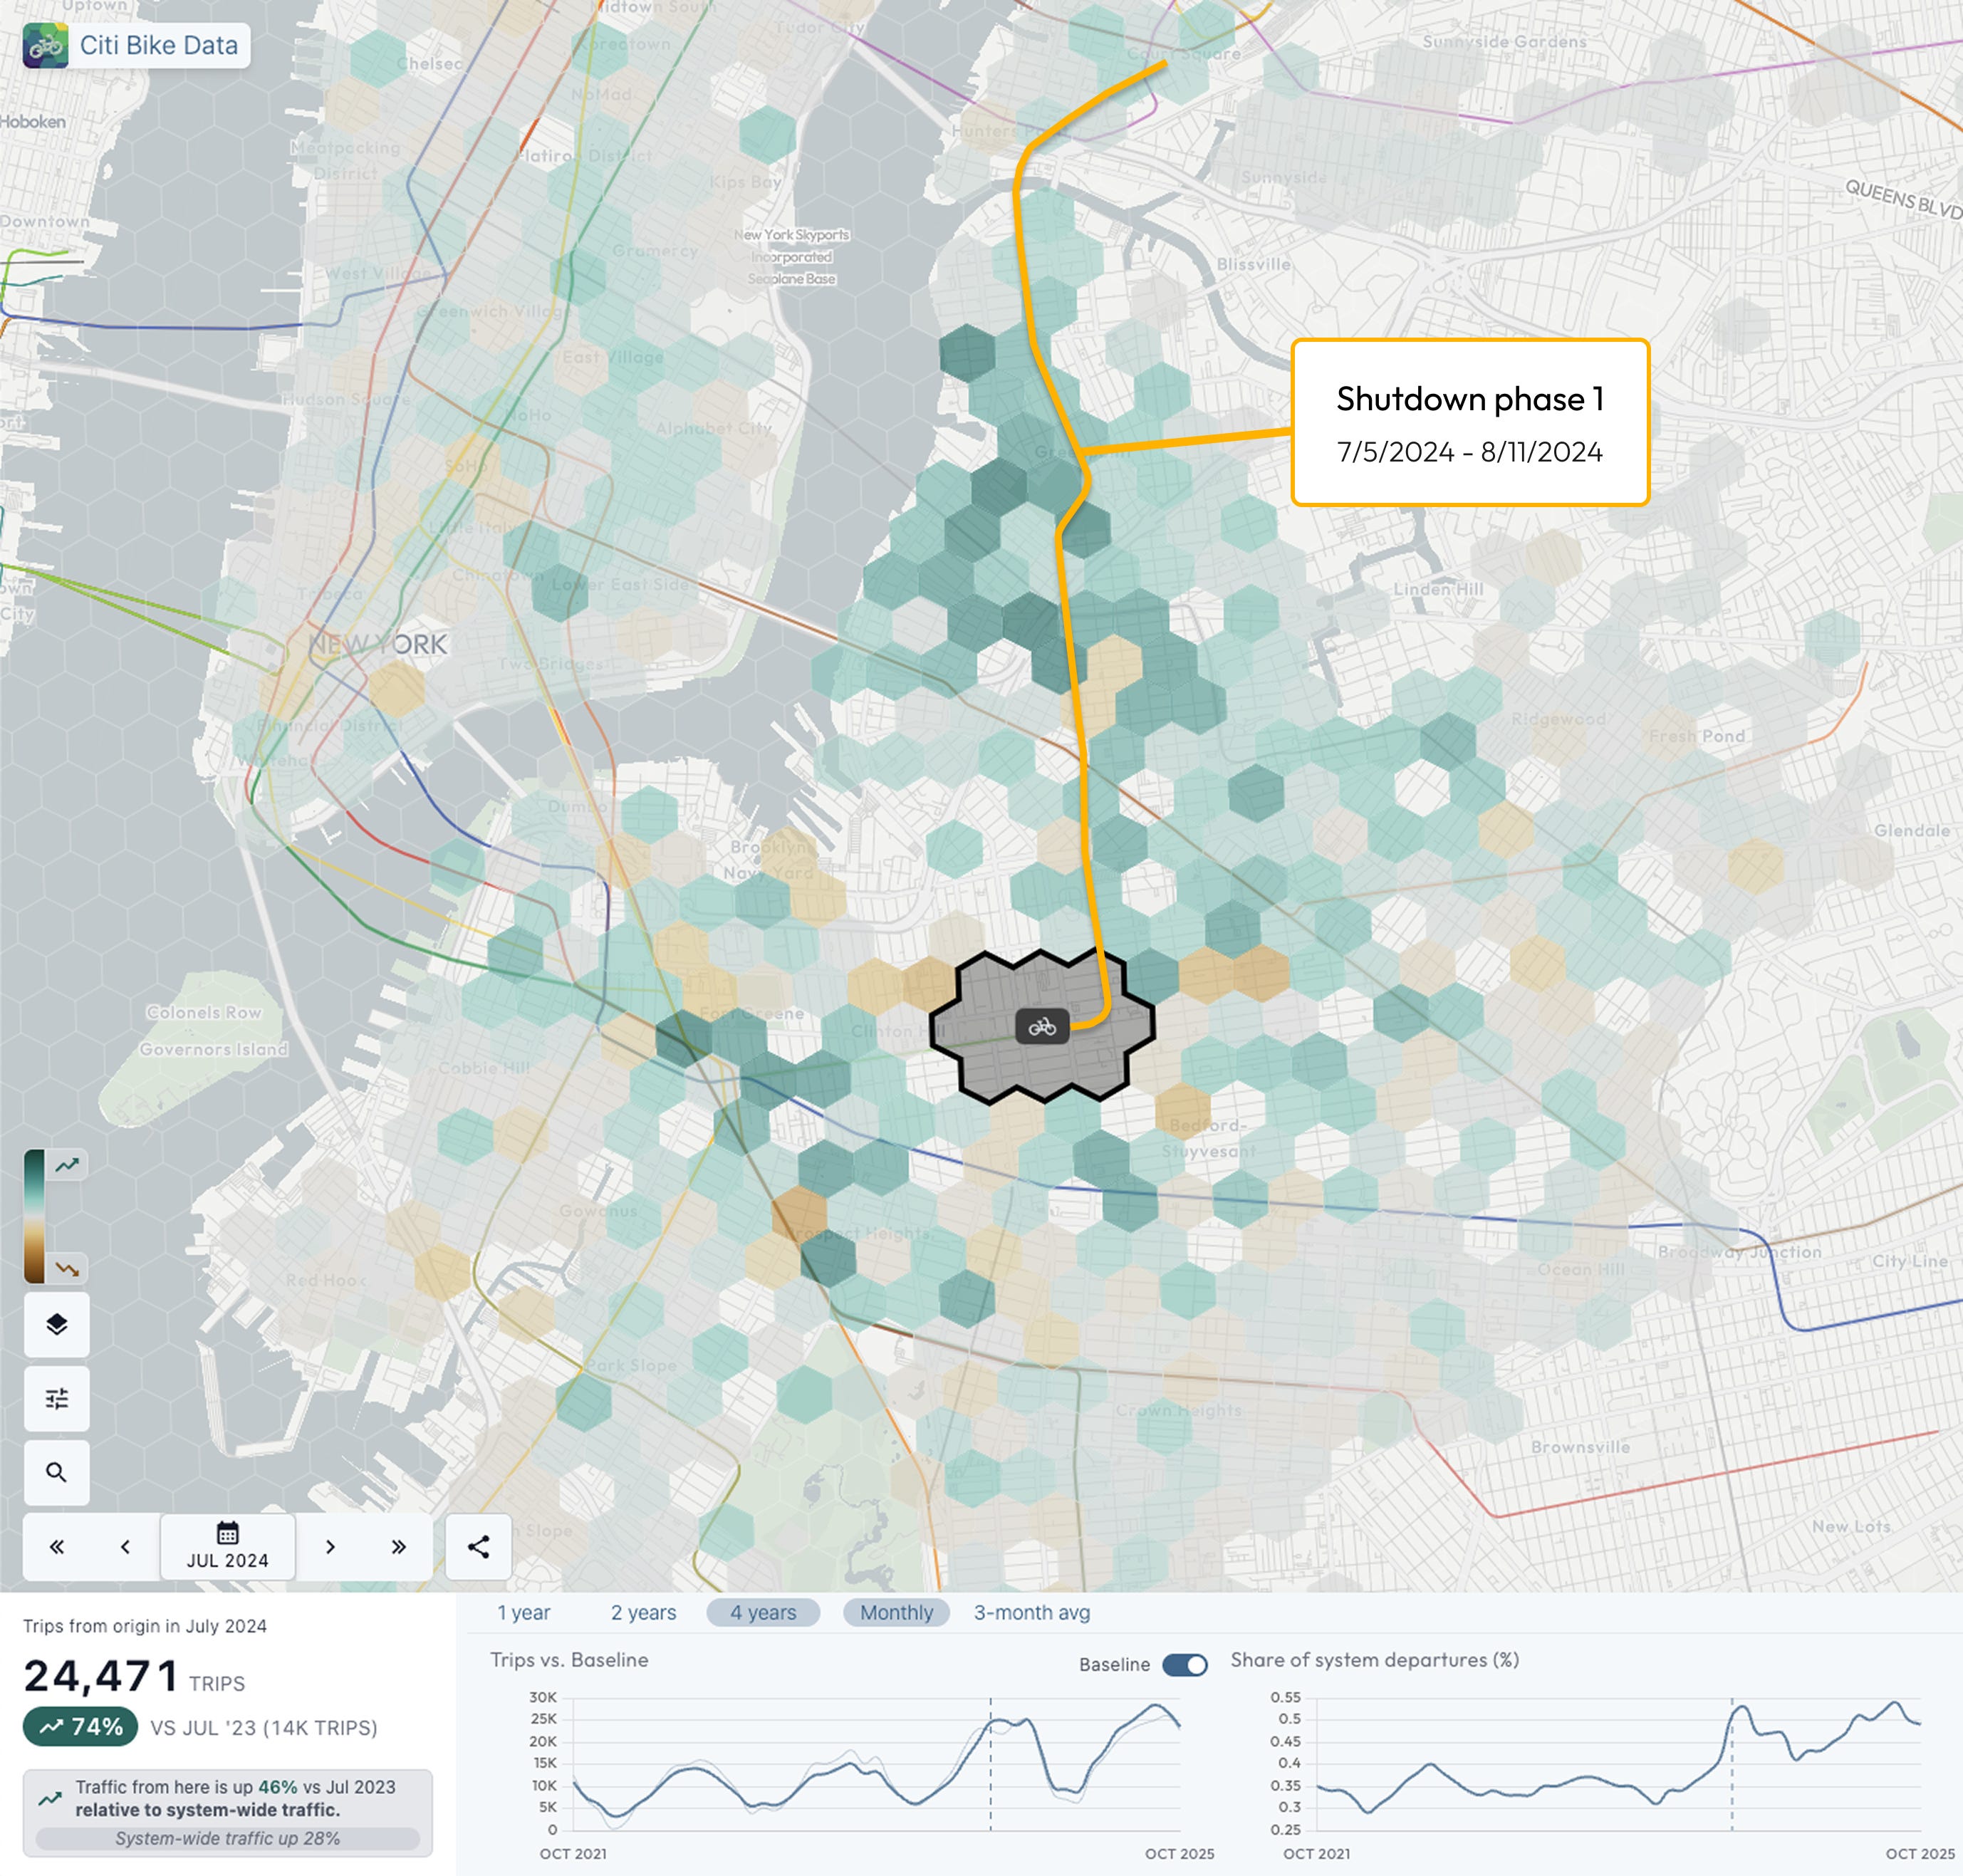
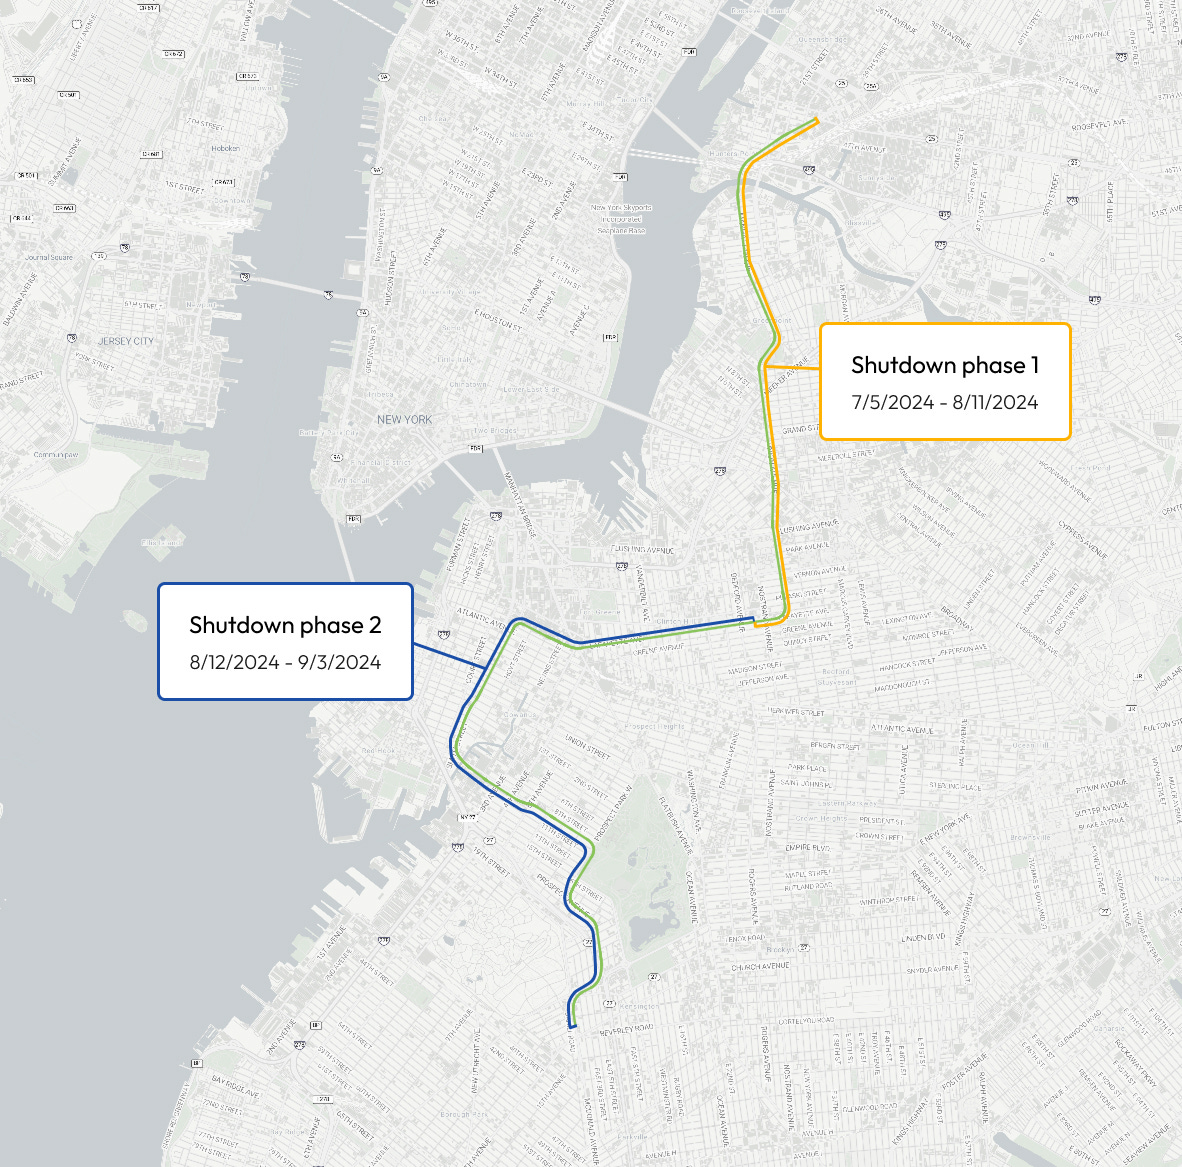
The orange line shows the area of the G train shutdown from July 5th to August 11th. We can clearly see a substantial increase in trips on the suspended section of the line. Let’s look at the stats.
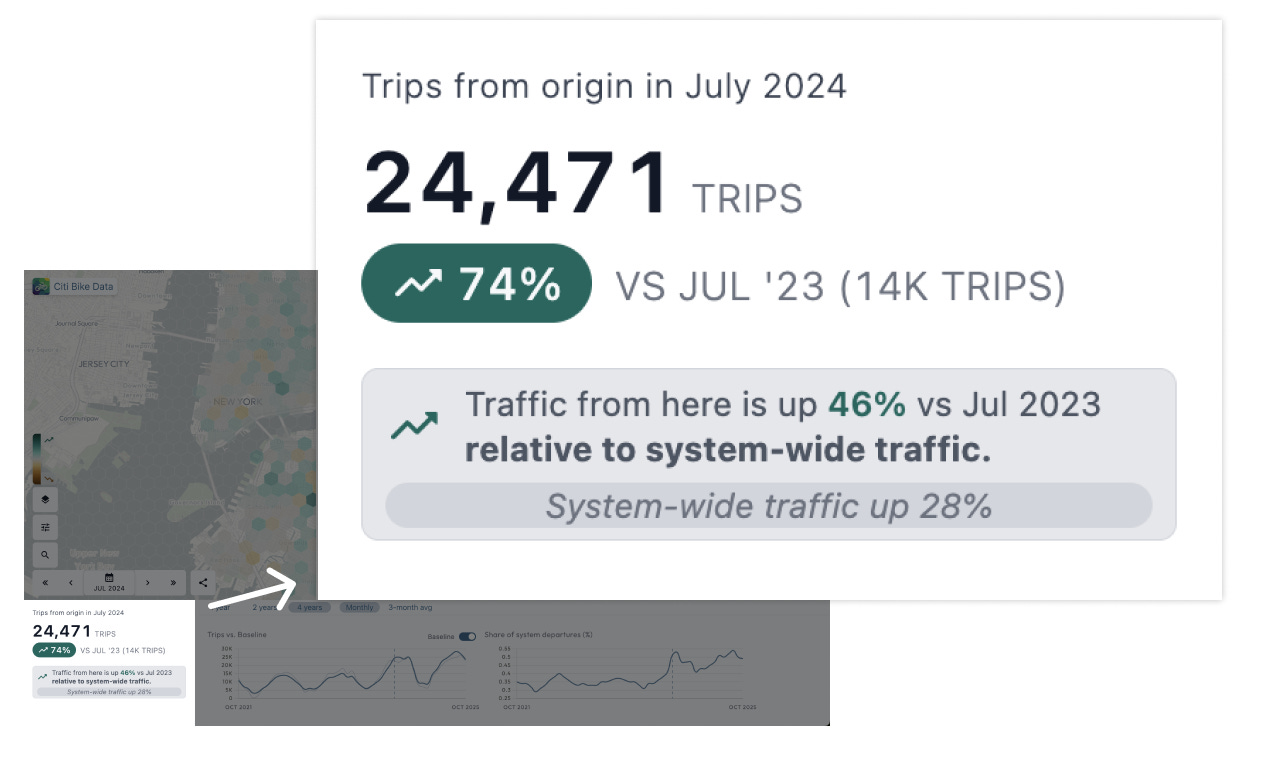
So from our selected origin at the Southern edge of the shutdown we see a 74% increase in absolute trips – a 46% growth over expected. Effectively, trips leaving this region increased 46% more than the rest of the city.
Let’s focus in on destinations along the shutdown to see if the change is even more pronounced.
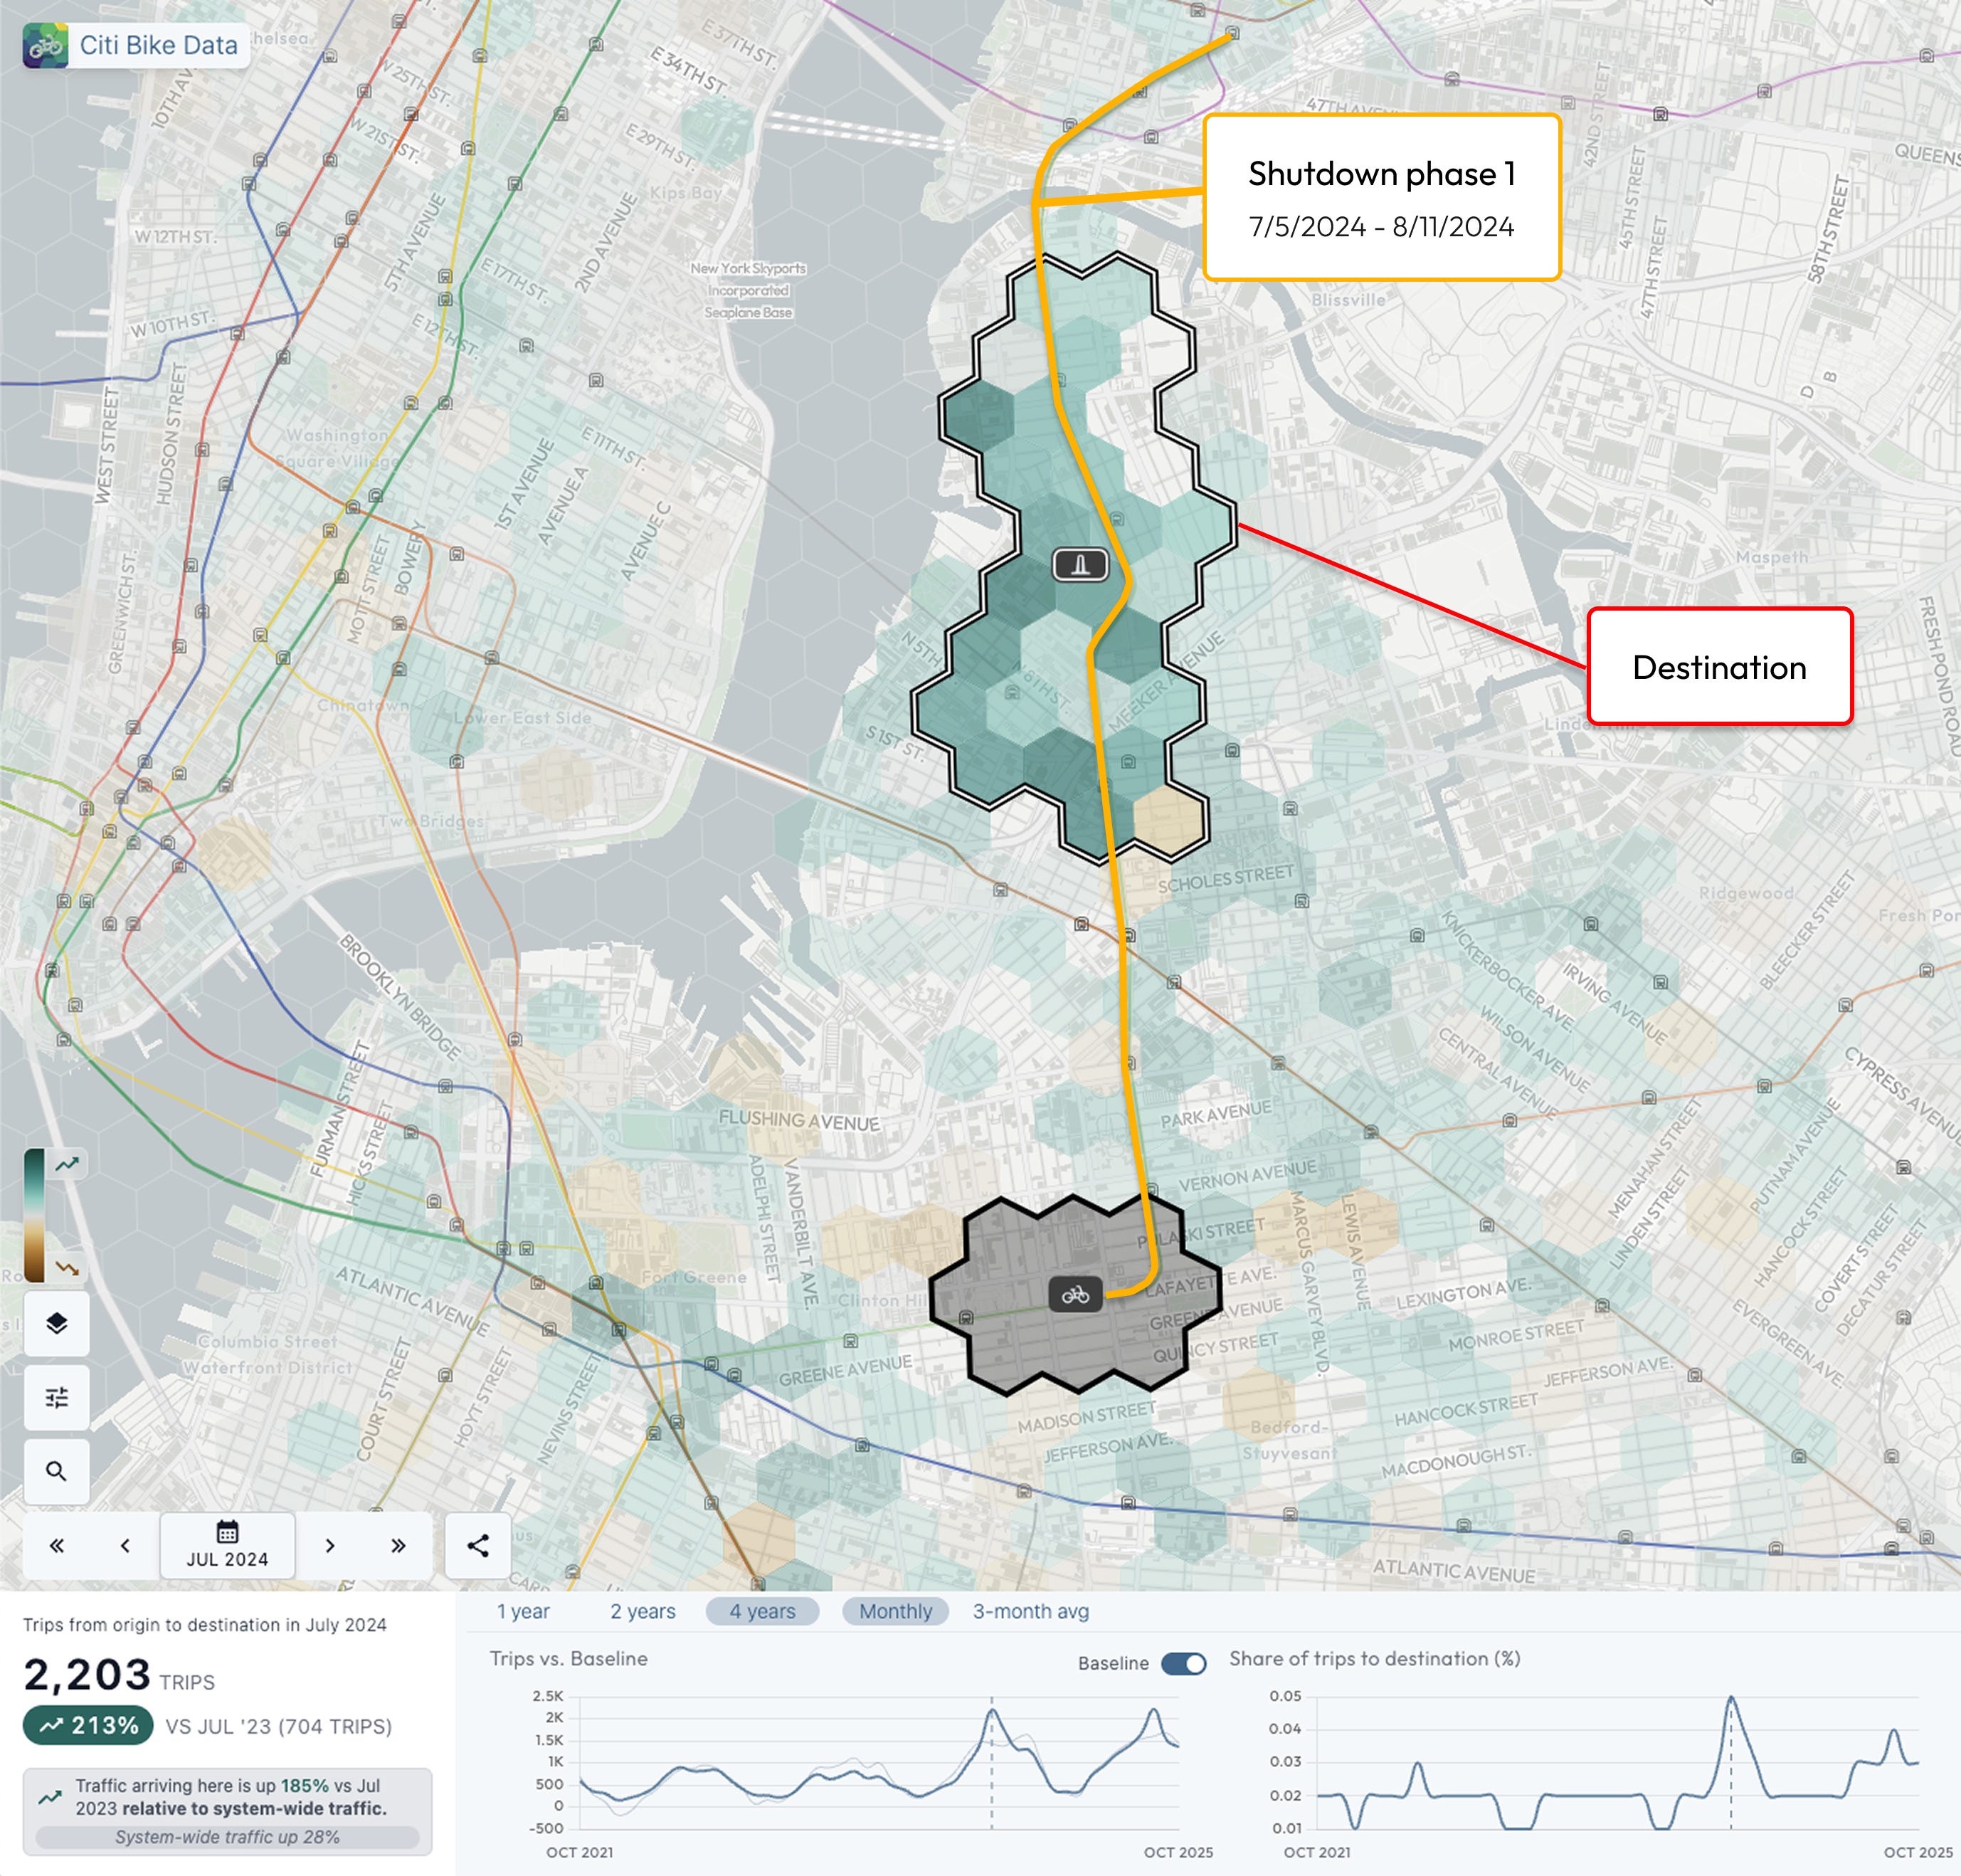
We’ve added a destination along the shutdown. Looking at the stats we see a 185% growth rate above expected (213% actual). Trips to this destination from our origin went from 704 in 2023 to 2,203 in 2024.
This makes it evident that the shutdown is the driving force behind the increased bike share usage in the area.
The second phase of the shutdown on the Southern section of the G train during August had similar results. We can confidently say that many G train riders turned to Citi Bike for an alternative method of transportation.
What happened after the shutdown?
The real story emerges after the shutdown ends. We might expect Citi Bike trips to return to normal after the shutdowns. The shutdown ended on September 3rd. In the month of September Citi Bike traffic from our selected origin was still up 44% over expected. In October it was up 50%. The image below shows the comparison map for October 2024 vs. October 2023.
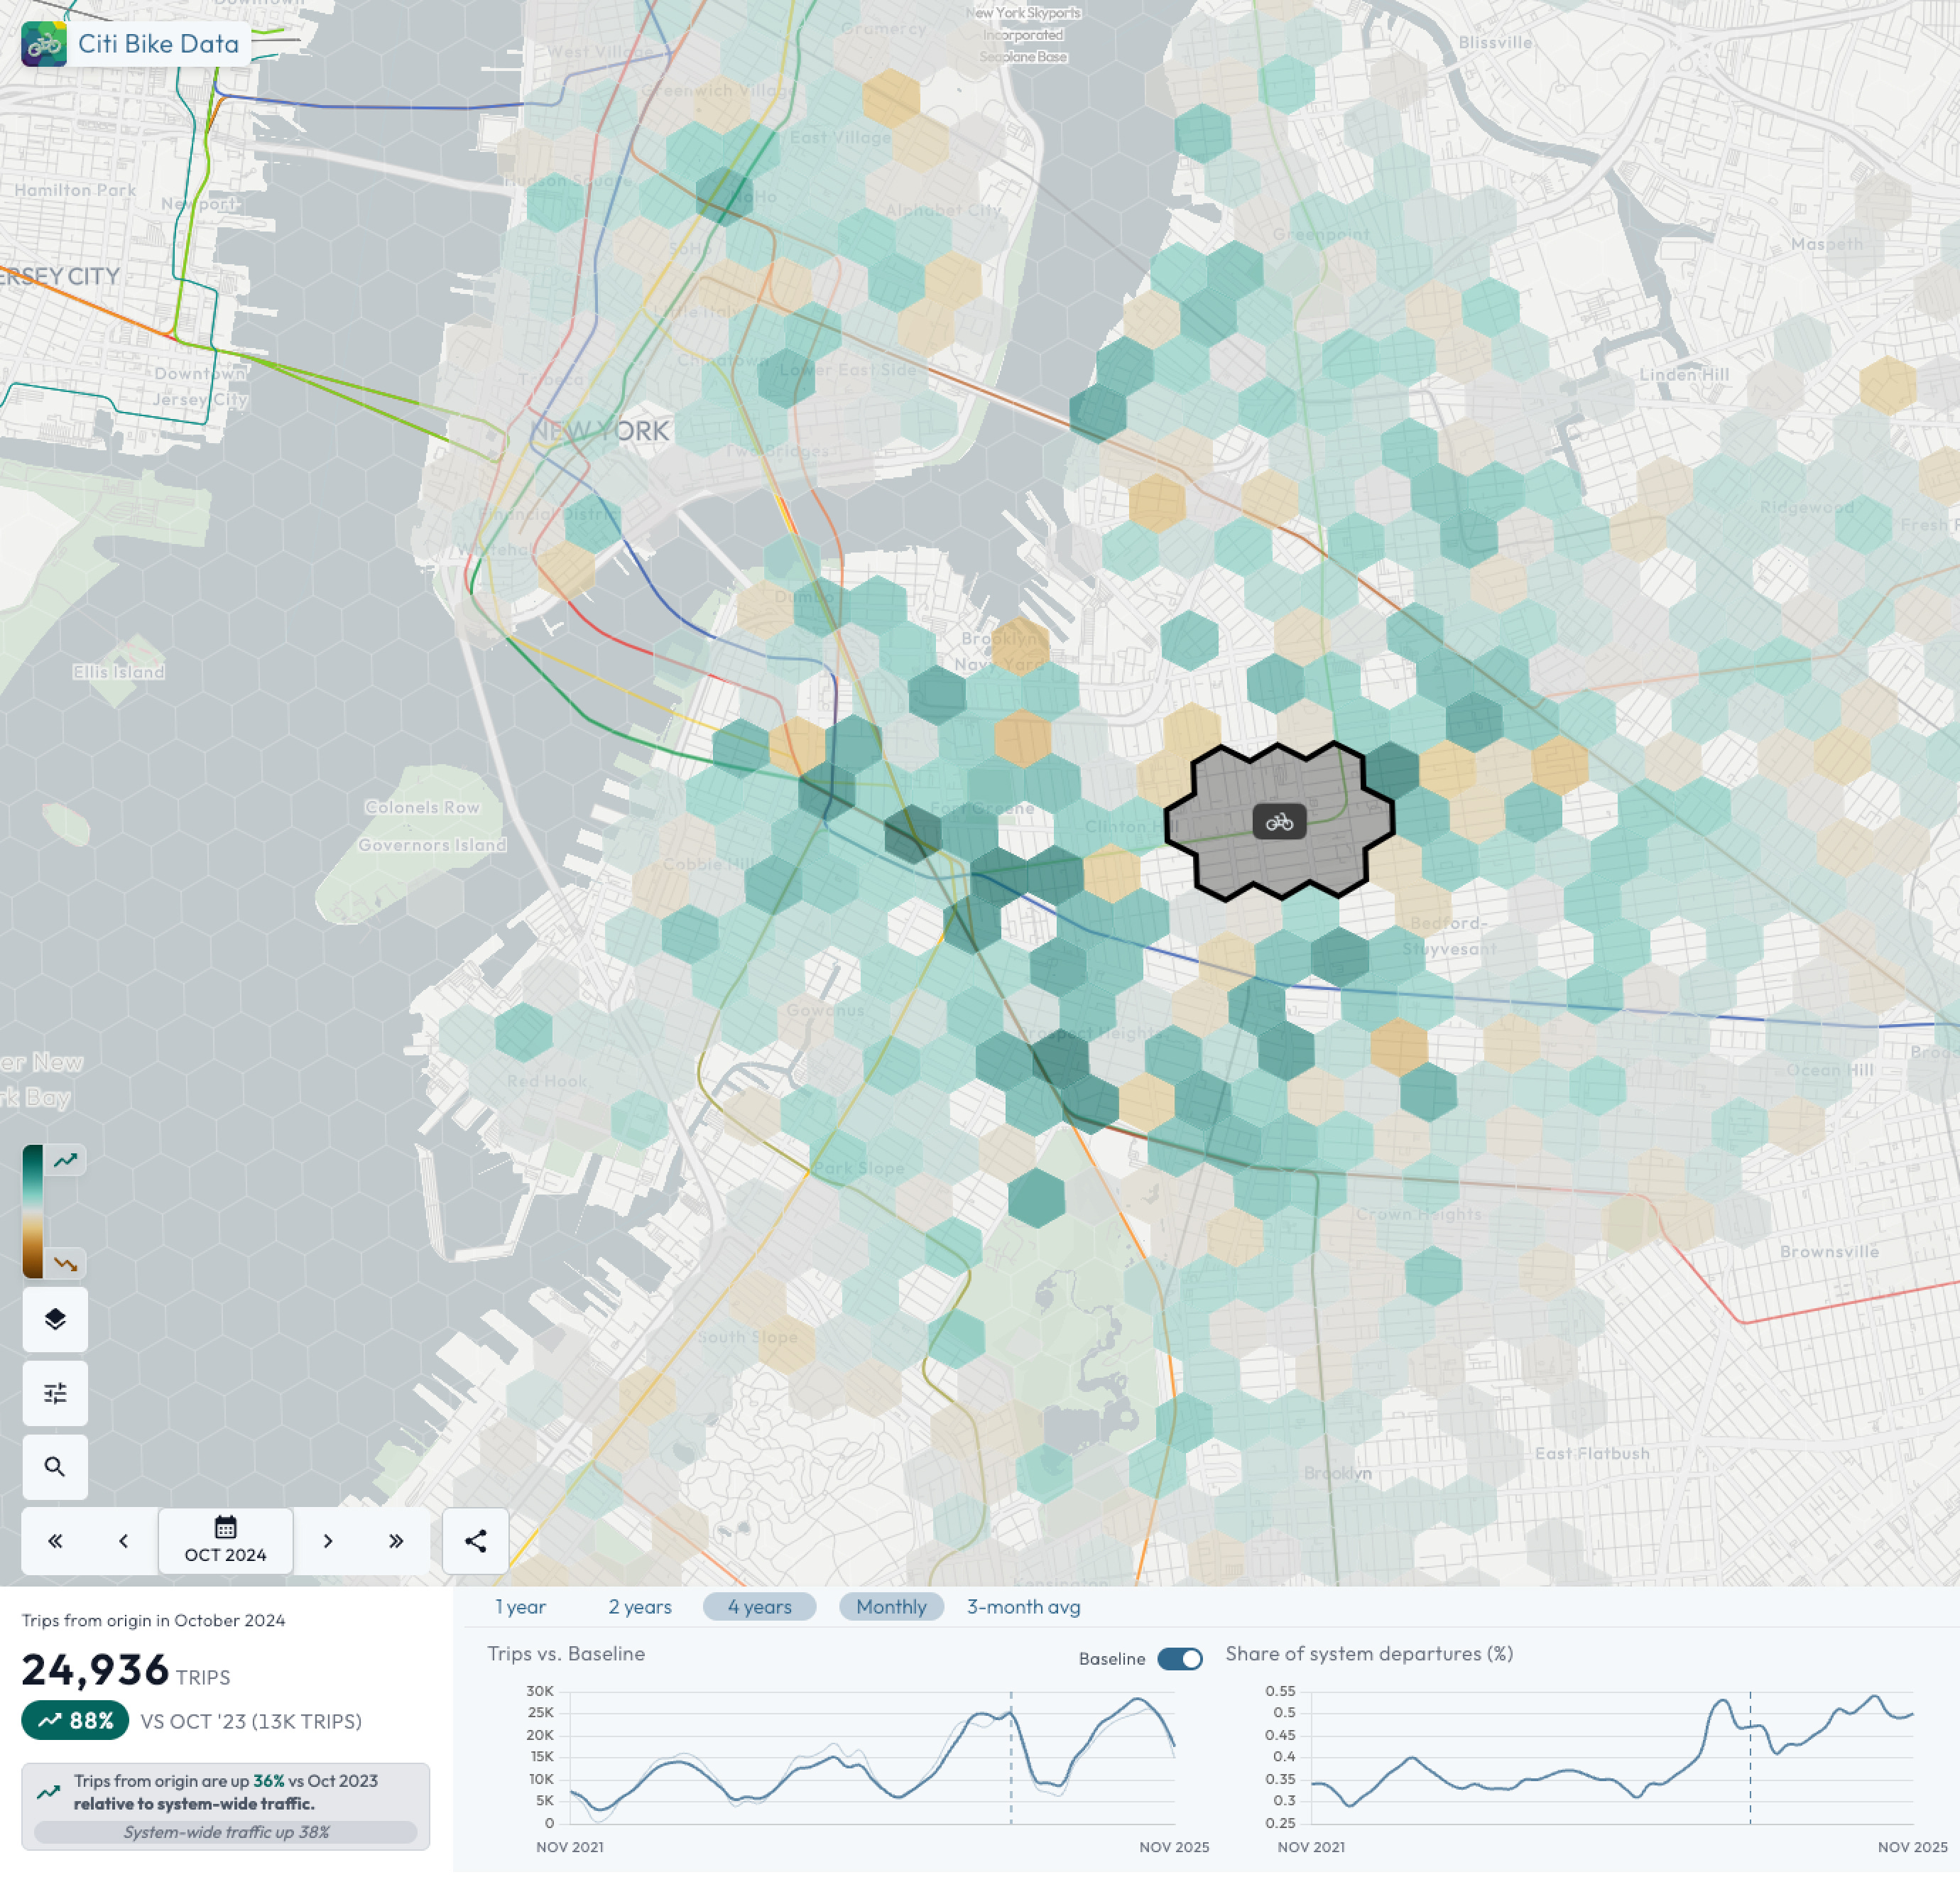
What is really interesting is that the increases are now evenly spread - no longer just along the G train route.
I summed up the 9 months following the shutdown to compare them to the equivalent months before the shutdown (Sep 2023 — May 2024 Vs Sep 2024 — May 2025). What I found is that over this period trips from our selected region grew 58.6% while overall system traffic grew 16.6%. This means traffic from the region was 36% higher than expected.
Before the shutdown this region averaged 343 outbound trips per day. With overall system growth we would have expected to see about 400 trips per day post-shutdown. Instead we saw 547 trips.
That means the shutdown lead to an increase of 147 trips per day from this region.
What does this mean?
Transportation habits may be more malleable than we think. We often assume people are set in their routines, but this data suggests otherwise. When riders were pushed to try something new, many stuck with it. Sometimes the biggest barrier is simply taking the first step.